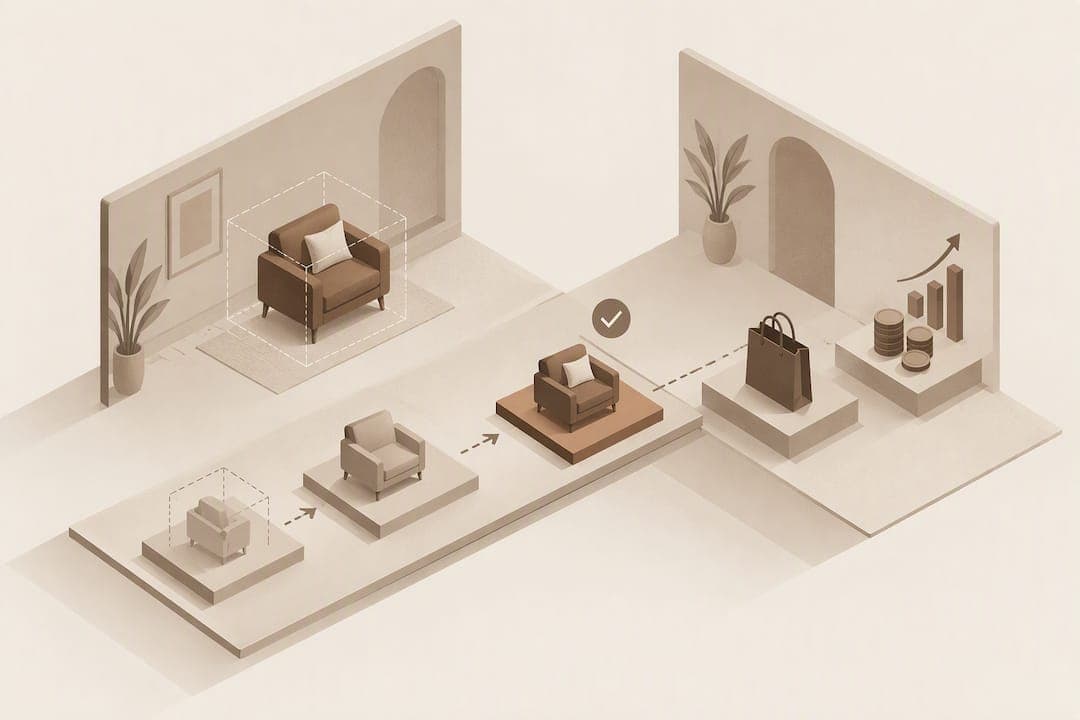
AR delivers positive ROI for furniture retailers when it is measured properly, and the two levers that matter most are conversion uplift and return-rate reduction. Average order value and engagement rates move too, but the case for scaling an AR programme rests on whether incremental margin beats the cost per preview, confirmed through controlled testing rather than headline multipliers.
TL;DR:
- Focusing on conversion uplift and return-rate reduction provides the strongest ROI signals, with return reduction being critical due to high reverse logistics costs in furniture.
- Pilot tests should measure incremental revenue per preview, compare against baseline, and include a controlled A/B or geographic split with a full return window of 30 to 90 days.
- High-traffic, high consideration SKUs like sofas and large case goods are ideal initial targets, with fast, simple photo-compositing tools that require no 3D assets.
- Technical and UX issues, such as slow load times or missing specifications, can undermine trust and skew results, so QA and randomised exposure are essential for accurate measurement.
- Cost-effective solutions like AI Furniture's widget, which offers free previews and quick setup via existing product images, enable rapid pilot testing with a clear payback timeline.
Table of Contents
- Core metrics to measure AR ROI for furniture
- Measurement design and a worked model you can adapt
- Rollout checklist and product-mix strategy
- Common failure modes and protecting your ROI
- Publisher's practical option: how AI Furniture Solutions supports quick, low-friction trials
- Case studies and industry examples worth knowing
- How AR interacts with return policy and reduces return behaviour
- Cost of AR implementation and ROI break-even timeline
- AR versus traditional marketing channels for furniture ROI
- Building the business case: getting stakeholder buy-in
- When AR is worth scaling: a short recommendation
- How to start a measurable test with AI Furniture Solutions
- FAQ
- Sources
Core metrics to measure AR ROI for furniture
Three groups of numbers tell you whether AR is paying for itself. Commercial KPIs come first: conversion rate lift, preview-to-cart rate, order conversion, average order value and return-rate reduction all translate directly into revenue or avoided cost. Return reduction matters more in furniture than almost any other category, because reverse logistics on a sofa or wardrobe is expensive and slow.
Engagement KPIs tell you whether shoppers are actually using the tool: preview rate (the share of product page visits that launch a preview), completion rate, time spent in preview and the number of product interactions per session. A high preview rate with a low completion rate usually points to a technical or UX problem rather than disinterest.
Operational KPIs close the loop: per-preview cost, implementation and engineering time, and ongoing support or QA load.
- Track conversion lift and return-rate change against a pre-AR baseline, not against industry averages.
- Treat preview completion rate as a leading indicator of commercial impact, not a vanity metric.
- Separate engineering and support costs from per-preview fees so the true cost per incremental order is visible.
A 2022 study of 383 respondents found that AR system quality, product informativeness and interaction shape perceived benefit and adoption, which means completion rate and interaction depth deserve as much attention as raw preview volume.
Pro Tip: Calculate incremental revenue per preview (not per visitor) early on, it is the single number that makes pilot results comparable across SKUs.
To turn KPI movement into a dollar figure, multiply incremental orders by your average contribution margin, then subtract total preview costs for the test period. That net number, not the conversion percentage alone, is what justifies a wider rollout.
Measurement design and a worked model you can adapt
A credible ROI case needs a measurement plan, not just a dashboard. Four steps get you there.
- Set a baseline: record conversion rate, average order value and return rate for your hero SKUs over a representative period, ideally four to eight weeks, before any AR exposure.
- Instrument every funnel step: tag preview start, preview complete, add-to-cart after preview and order confirmation, so you can isolate the preview's contribution rather than guessing from aggregate sales.
- Run a controlled test: an A/B split where traffic allows, or a geo or temporal holdout when page-level randomisation is impractical. Shopify's guidance on AR furniture recommends geo or temporal holdouts specifically when PDP-level split testing is hard to engineer, and suggests tracking returns for at least one full return window, typically 30 to 90 days, before finalising an estimate.
- Compute incremental contribution margin: (incremental orders × margin per order) minus incremental preview cost, then divide your one-off implementation cost by that monthly net figure to estimate payback.
A short worked example illustrates the mechanics. A pilot lifts conversion enough to add 20 incremental orders a month and cuts returns by two units, while 3,000 previews are run at the standard $0.10 extra-preview fee. Incremental margin is 20 × $150 = $3,000, plus avoided return cost of 2 × $40 = $80, minus preview cost of 3,000 × $0.10 = $300, for a net monthly gain of $2,780. Against a one-off setup cost of, say, $2,000, that pilot would pay back in well under a month, though real payback periods vary widely with traffic, margin and setup scope.
Gunner Kennels reported a 40% increase in order conversion and a 5% reduction in return rate after adding 3D and AR capability, a useful benchmark for sense-checking your own pilot assumptions, not a guaranteed outcome.
Rollout checklist and product-mix strategy
Pilot results depend heavily on which products you choose first; following expert advice on how to select art size for your home can similarly help curate hero SKUs with the right scale and fit considerations. Hero SKUs for an AR pilot should combine high traffic, high consideration time and genuine fit uncertainty, think sofas, sectionals and large case goods where shoppers hesitate over scale and finish. Low-traffic or impulse-purchase items rarely generate enough data to reach statistical confidence within a reasonable pilot window.
- Prioritise SKUs where returns are already concentrated due to size or colour mismatch.
- Keep the preview fast and low-friction: a photo-based compositing flow with no app download removes a major drop-off point compared with marker-based AR apps.
- Add clear scale markers and visible product metadata, dimensions, fabric and delivery lead time, directly in the preview interface.
- Instrument preview start, preview complete, add-to-cart-after-preview and post-purchase return status as core events, each tied to SKU and session ID.
Operationally, plan your preview quota against expected traffic before committing budget, build a lightweight QA process to check colour and scale accuracy on a sample of outputs weekly, and brief your support and returns teams on how to interpret preview-sourced orders, since these customers often arrive with fewer fit-related questions.
Pro Tip: Pilot on three to five hero SKUs rather than one; a single product cannot separate a genuine AR effect from normal week-to-week demand noise.
Common failure modes and protecting your ROI
Several problems quietly erase expected uplift. Technical failures, slow load times, inaccurate plane detection and incorrect scale, undermine trust the moment a shopper sees a sofa that clearly does not fit the room. UX failures compound this: unclear calls to action or missing specs such as dimensions and delivery lead time leave shoppers unsure what to do next.
Measurement failures are subtler. If only highly purchase-ready shoppers use the preview, you risk selection bias that inflates apparent conversion lift.
- Reject placements that exceed your scale-error tolerance during QA rather than shipping them live.
- Randomise exposure where possible, or use a holdout cohort to isolate the AR effect from general demand shifts.
- Set a minimum sample size before declaring results, and report confidence alongside the headline figure.
- Focus every pilot report on incremental contribution margin, not raw preview counts.
Publisher's practical option: how AI Furniture Solutions supports quick, low-friction trials
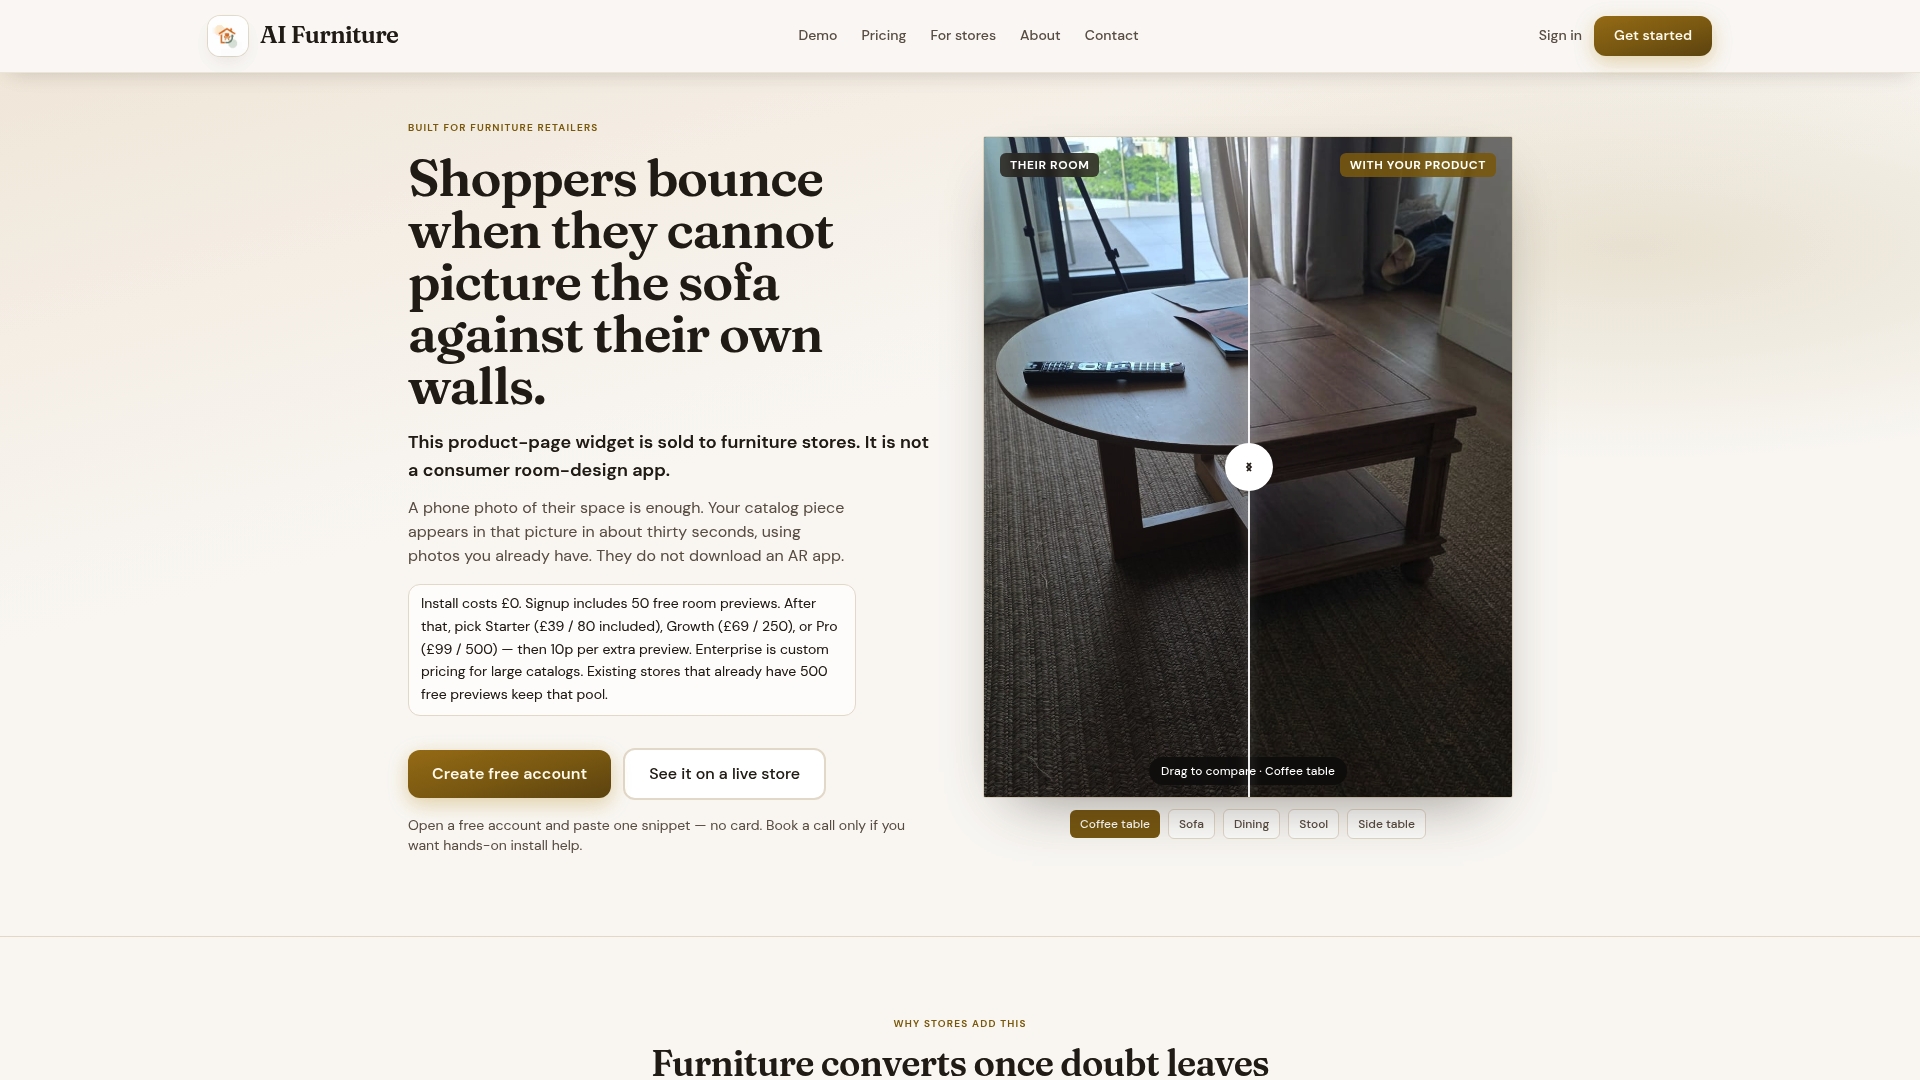
We built our widget specifically to make this kind of pilot easy to run without committing to 3D modelling or an app-based AR stack. Shoppers upload a photo of their own room, and within 30 seconds we superimpose the retailer's product onto that photo, giving a realistic preview without any download.
- Our widget uses the product photos retailers already have, so there is no 3D asset pipeline to build before testing starts.
- Previews complete in roughly 30 seconds, which keeps completion rates high compared with heavier AR flows.
- Photo compositing rather than full 3D modelling keeps setup simple across storefronts, since it works from existing JPEG images.
- Every new account starts with 500 free previews, enough to run the measurement model above on three to five hero SKUs before any cost is incurred.
Running that free allowance against the baseline-and-holdout approach described earlier gives most teams a usable payback estimate before they spend anything.
Case studies and industry examples worth knowing
It is a striking headline, but it is a single retailer's reported outcome at full catalogue scale, not a benchmark you should plug into your own model without validating it against pilot data.
More granular, independently documented numbers come from Shopify's merchant case studies. Gunner Kennels saw a 40% increase in order conversion and a 5% reduction in returns after adding 3D and AR, alongside a smaller lift in cart conversion. Rebecca Minkoff's case shows a similar pattern from the interaction side: shoppers who engaged with 3D content were 44% more likely to add to cart and 27% more likely to place an order, while those who used AR specifically were 65% more likely to order, according to merchant-reported figures in a short paper on the case.
The pattern across these examples is consistent even where the multipliers differ: interaction with 3D or AR content correlates strongly with higher purchase intent, and the commercial gains that repeat most reliably are conversion lift and reduced returns, exactly the two levers worth tracking in your own pilot.
How AR interacts with return policy and reduces return behaviour
AR does not replace your return policy; it changes how often shoppers need to use it. A 2026 Frontiers study found that augmented reality strongly mediates the effectiveness of return-policy measures in preventing returns, with statistically significant indirect effects across several return-policy factors in a cross-sectional study of 209 respondents.

In practice, this means AR works best alongside clear policy communication rather than instead of it. A shopper who previews a sofa accurately and still returns it has usually encountered a genuine mismatch the preview could not resolve, fabric feel, for instance, so your returns data should separate fit-and-scale returns (the category AR targets) from quality or preference returns (the category it does not).
Cost of AR implementation and ROI break-even timeline
Implementation cost varies by approach. Photo-compositing widgets, like the model described above, typically carry no setup fee and a small per-preview charge once a free allowance is used, while full 3D modelling or marker-based AR apps involve asset creation costs per SKU and longer integration timelines. Our own plans, for example, run from $52.56 a month on the Starter tier up to $133.42 a month on Pro, with Enterprise pricing available on request, and an extra preview costs $0.10 once the included allowance is used, with no setup fee.
Break-even timing depends almost entirely on traffic and margin, not on the technology choice itself. The worked example earlier showed a net monthly gain of $2,780 against a $2,000 setup cost, implying payback inside the first month, but that assumes the pilot's conversion and return figures hold. A lower-traffic SKU with the same percentage uplift will simply take longer to accumulate enough incremental orders to clear the same setup cost, which is exactly why hero-SKU selection matters as much as the technology decision.
AR versus traditional marketing channels for furniture ROI
Traditional channels, paid search, social ads, email, generally drive traffic and top-of-funnel awareness, but they do little to resolve the specific hesitation that stalls furniture purchases: will this actually fit, and will it look right. AR and photo-preview tools operate further down the funnel, acting on shoppers who have already arrived at a product page and are deciding whether to commit.
That difference shows up in what each channel actually moves. A paid campaign typically reports cost per click or cost per acquisition; an AR pilot reports conversion lift and return-rate change on existing traffic, with no additional media spend required to generate the uplift. The two are not substitutes for each other, a retailer still needs traffic to reach the product page in the first place, but AR tends to show a clearer line to incremental margin because the baseline-and-holdout model isolates its effect precisely, whereas attribution across multiple marketing channels is often blended and harder to isolate. For a retail or e-commerce team building a business case, the practical comparison is less "AR versus ads" and more "where does the next marginal dollar generate measurable incremental margin": on new traffic, or on converting the traffic you already have.

Building the business case: getting stakeholder buy-in
The strongest internal case for AR investment leads with the worked model, not with the technology. Finance stakeholders respond to incremental contribution margin and payback period; they are far less persuaded by preview counts or engagement percentages on their own.
Structure the pitch in three parts. Start with the cost of the problem you are solving, quantify current return rates and their logistics cost on your highest-return furniture categories, since that number alone often justifies a pilot budget. Follow with a small, time-boxed pilot proposal: three to five hero SKUs, a defined baseline period, and a holdout cohort, so the commitment feels contained rather than catalogue-wide. Close with the decision rule you will use afterwards: scale if incremental margin after preview costs is positive and statistically supported, pause if it is not.
Operations and merchandising teams tend to need a different argument: fewer returns means less reverse logistics handling and fewer refunds processed, which is a direct cost saving independent of any conversion lift. Framing the pilot around a measurable decision rule, rather than a belief that AR works, is what gets a cautious retail organisation to commit budget to the first test.
When AR is worth scaling: a short recommendation
Scale only once a pilot shows statistically supported incremental margin after preview costs, and once return reduction visibly lowers operating cost. Expand category by category rather than catalogue-wide in one move. Where system-quality thresholds cannot be met on certain SKUs, such as highly reflective finishes or irregular shapes, leave those out rather than forcing a weak preview to go live.
— Michael
How to start a measurable test with AI Furniture Solutions
The fastest way to find out whether AR works for your catalogue is to run the numbers on your own products rather than someone else's case study. We offer 500 free previews to new accounts, enough to test three to five hero SKUs against the measurement model above before any cost is incurred, and our universal demo page lets you bake off the widget directly against a product URL you already sell.
- Tag preview start, preview complete and add-to-cart-after-preview before you launch, not after.
- Link each preview session back to its product page so results map to specific SKUs.
- Track returns for at least one full return window before judging the pilot's impact.
Once your trial previews are used, we can export the usage data so your team can drop it straight into the payback model above. Start the trial on our furniture visualizer page when you are ready to test it against your own catalogue.
FAQ
What is AR furniture?
AR furniture refers to tools that let shoppers see how a piece of furniture would look in their own space before buying, either through camera-based augmented reality apps or through photo-compositing widgets that superimpose a product onto an uploaded room photo. Both approaches aim to resolve the same uncertainty: fit, scale and style match.
What does AR stand for in interior design?
AR stands for augmented reality, the overlay of digital objects, such as a virtual sofa or table, onto a real environment viewed through a camera or photo. In interior design and furniture retail, it is used specifically to preview products in a customer's own room before purchase.
How can I see furniture in my room?
Most retailers now offer either an AR app that uses your phone's camera to place a 3D model in your space, or a simpler photo-upload tool that composites the product directly onto a picture you take of your room. The photo-based route generally requires no app download, which tends to produce higher completion rates according to adoption research on AR system quality and interaction.
How long does it take to see ROI from AR in furniture retail?
Payback period depends on traffic, margin and the uplift achieved, but a well-designed pilot on high-consideration SKUs can show measurable incremental margin within weeks, as shown in the Gunner Kennels case study, where conversion and return improvements were visible against a prior-quarter baseline. Retailers should still validate figures with their own baseline and holdout test rather than assuming industry case results will repeat exactly.
Sources
- Consumer Perception and the Evaluation to Adopt Augmented Reality in Furniture Retail Mobile Application | Binus Business Review
- Mitigating return behaviour through policy innovation: the mediating influence of augmented reality in online retailing | Frontiers
- Augmented Reality Furniture: 5 uses and benefits - Shopify