
The single highest-leverage move is to measure the true cost of every return, then redirect that insight into two channels: converting refund intent into exchanges, and closing the product-page gaps that caused the return in the first place. Retailers that do this consistently see exchange conversion rates in the range reported by the industry on optimised flows and combined return-rate reductions of 4 to 8 percentage points within a couple of quarters.
TL;DR:
- Tracking cohort-based return rates and all-in costs helps identify the true impact of returns and prioritize prevention efforts accordingly.
- Improving product detail page content, including imagery and videos, significantly reduces expectation gaps and can lower furniture return rates by 20–30%.
- Implementing exchange-first flows, with rapid routing and inspection, can convert up to 40% of potential refunds into retained revenue.
- Establishing clear grading and routing protocols at the warehouse maximizes recovery from returned inventory, especially through resale and refurbishment channels.
- Assigning a dedicated owner for returns analysis ensures continuous monitoring, timely interventions, and prevents scattered reporting from impairing decision-making.
Table of Contents
- What is ecommerce returns analysis and why does it matter now?
- How do you calculate the true economics of a return?
- Which root causes drive most returns, and how do you fix them?
- What does a working returns operations stack look like?
- How should you grade and route returned inventory for maximum recovery?
- What is a realistic 60-day test plan for returns reduction?
- Which data sources and tools actually make returns analysis possible?
- Can predictive models actually forecast which orders will come back?
- How much do returns really cost beyond the refund itself?
- How can retailers turn returned stock into revenue, not just recovered cost?
- What do successful returns programmes actually look like in practice?
- Why returns need a named owner, not a shared responsibility
- Cut furniture returns before they happen with a room‑preview widget
- Sources
- FAQ
What is ecommerce returns analysis and why does it matter now?
Ecommerce returns analysis is the practice of tracking, costing, and acting on return data at SKU, cohort, and channel level, rather than treating returns as an unavoidable line item buried in logistics spend. Done properly, it turns returns management in ecommerce from a defensive cost centre into a source of margin recovery and customer insight.
Retailers who skip this step tend to know their headline return rate and little else. They rarely know which SKUs drive the cost, whether a return converts to a repeat customer or a lost one, or how much resale value evaporates while a returned sofa sits in a warehouse for a week. The metrics below are the starting point for closing that gap.
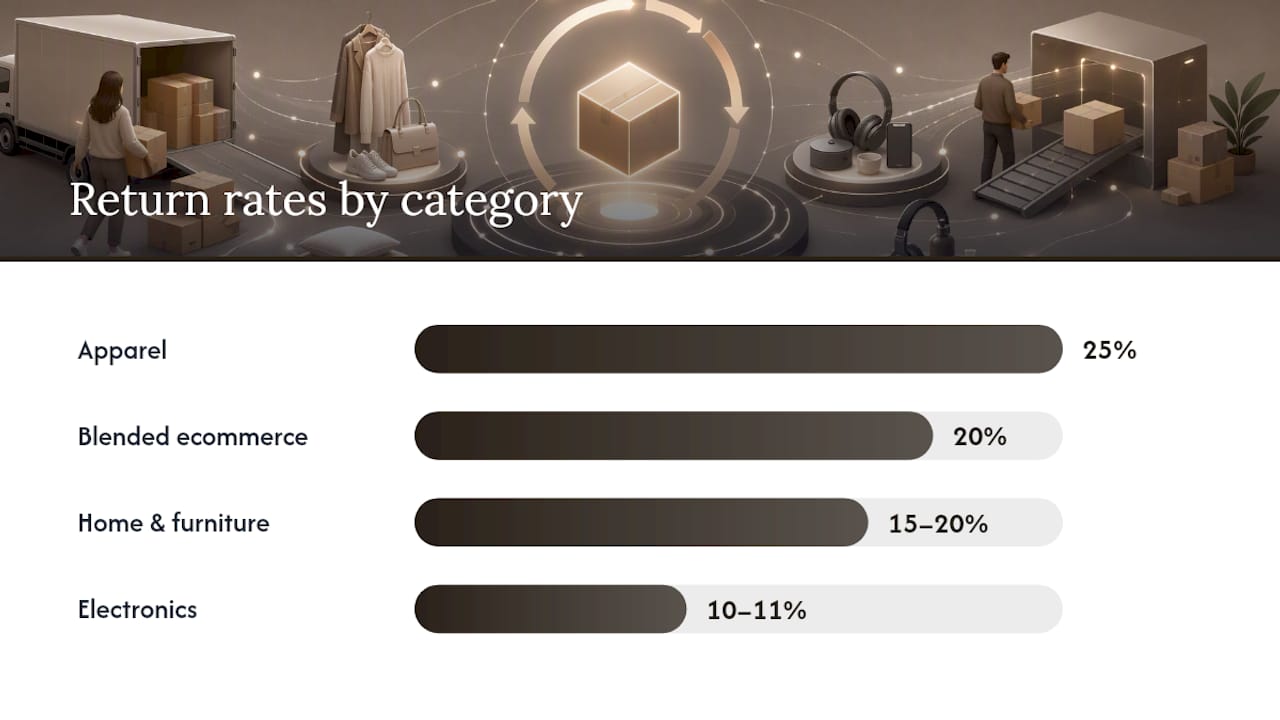
- Blended ecommerce return rate runs at roughly 19–21% across categories in 2026, with wide variance by vertical.
- Apparel averages around 25%, ranging from 20% to 40% depending on fit complexity and size range.
- Home and furniture sits lower, typically 15–20%, but each unit costs more to move and restock.
- Electronics average around 10–11%, helped by tighter spec accuracy on listings.
- Cost per return ranges from $10 to $65 depending on category and complexity; shipping is usually the smallest slice, not the biggest.
Pro Tip: Don't benchmark your return rate against the blended average. Compare it against your own category's range. A furniture retailer running 22% returns isn't average, it's underperforming against a 15–20% band.
Five KPIs matter more than the headline number: gross return rate (units returned divided by units shipped), net return rate (adjusted for exchanges, which don't count as lost revenue), exchange rate, time to restock (TTR, from receipt to saleable inventory), and processing cost per unit. Track these weekly, not quarterly, and by SKU, not just by category.
How do you calculate the true economics of a return?
Most finance teams undercount returns because they use calendar-period return rates instead of cohort-matched ones, and because their cost model stops at reverse shipping.
- Match shipments to returns by cohort, not calendar month. If you shipped 10,000 units in March and 1,800 of those specific units come back over the following 90 days, your cohort return rate is 18%. Comparing March returns to March shipments instead conflates units from earlier months and distorts the number, often understating true returns for growing SKUs.
- Build the all-in cost-per-return. Add reverse shipping, warehouse processing labour, repackaging materials, a probability-weighted write-off (grade-adjusted expected resale loss), and lost contribution margin (CM2) on the original sale. A $120 jacket with $8 return shipping, $6 processing, $4 repackaging, and a 30% chance of a $20 write-off plus $15 in lost CM2 lands closer to $39 in true cost, not the $8 shipping figure most dashboards report.
- Book a returns reserve. Estimate expected future returns against current-period revenue using your cohort return rate and average cost, then hold that reserve against P&L rather than recognising full revenue at the point of sale. Most platform defaults recognise returns only when they physically happen, which understates the reserve and overstates near-term margin, particularly in high-return categories like apparel.
Which root causes drive most returns, and how do you fix them?
Nearly every return falls into one of four buckets, and each has a different fix.
- Expectation gaps. Photos, dimensions, or descriptions that don't match reality. This is the most common and most preventable cause of returns across categories.
- Fit and bracketing. Shoppers ordering multiple sizes or configurations intending to return the rest, common in apparel and, less obviously, in modular furniture.
- Damage and defect. Packaging failures, quality control gaps, or transit damage.
- Fraud and serial returns. A small cohort of accounts that drive disproportionate return volume, often through wardrobing or return abuse.
Expectation gaps deserve the first attention because they're the cheapest to fix and the highest-volume cause. Richer PDP content, 360° imagery, standardised sizing charts, and short product videos all chip away at this bucket without touching fulfilment costs. Visualisation and try-on tools push further: furniture and home retailers piloting room-preview tools have seen "not as pictured" returns drop materially, with reductions in the 20–30% range reported in targeted trials, while apparel fit tools tend to land in the 15–22% range. A conversion-focused PDP audit is a natural companion to this work, since the same content fixes that reduce returns usually lift add-to-cart rates too.
Policy design is the fourth lever, and the one most retailers reach for first when they should reach for it last. Tiered return windows, exchange-first defaults at checkout, and a modest return fee for cohorts with historically low lifetime value all reduce volume, but they work better once the upstream content problems are fixed. A policy fee on a return caused by a bad product photo just makes customers angry twice.
What does a working returns operations stack look like?
A mature returns operation runs on three integrated layers: a consumer-facing portal, a routing engine, and warehouse or 3PL execution, and most retailers only have one or two of these actually talking to each other.
- Consumer portal. Where the shopper initiates the return, states a reason code, and is offered an exchange or store credit before a refund. Reason codes here feed directly into your root-cause taxonomy.
- Routing engine. Decides where the returned item goes based on reason code, product category, and condition reported by the customer. This is where exchange-first logic lives: an item flagged as "wrong size" routes to an instant exchange, while "damaged on arrival" routes to a claims workflow.
- WMS and 3PL execution. Physical receiving, grading, and disposition, ideally automated so grading rules trigger the right routing without manual review on every unit.
Exchange-first flows work because around a majority of consumers will accept an exchange or store credit over a cash refund if the process is fast, and merchants running instant-exchange features report converting 25–40% of what would otherwise be refunds. The trade-off is fraud risk: instant exchange before the original item is received requires a threshold, usually based on order value and customer return history, below which you approve automatically and above which you hold for inspection.
Pro Tip: Negotiate a receiving-to-inspection SLA with your 3PL aiming for rapid turnaround. Many run "receive first, triage later" workflows that leave items sitting 48 to 72 hours before grading even starts, which quietly erodes resale value on anything with seasonal or trend sensitivity.
How should you grade and route returned inventory for maximum recovery?
A written grading rubric with photographic reference examples for each grade turns disposition from a judgement call into a repeatable rule, and embedding it into the WMS means routing happens at scan, not after a human decides.
- Grade A (unopened, resaleable as new) routes straight back to sellable stock.
- Grade B (opened, cosmetically imperfect) routes to a discounted or open-box channel.
- Grade C (functional but damaged or incomplete) routes to refurbishment or B2B liquidation.
- Grade D (non-functional or unsafe to resell) routes to recycling or donation, where tax treatment often makes donation the better financial outcome over disposal.
Recovery channels vary widely in yield. Managed resale and certified refurbishment programmes tend to recover the most per unit, and operational playbooks that combine routing, grading, and exchange-first flows have converted 20–35% of return requests into exchanges while recovering $4 to $8 per returned unit through resale routing.
What is a realistic 60-day test plan for returns reduction?
Waiting for a perfect systems overhaul before testing anything is the most common reason returns programmes stall. Run these four workstreams in parallel rather than sequentially; the strongest programmes move several percentage points in a single quarter precisely because they don't wait for one lever before starting the next.
- Days 1 to 14: cost audit. Calculate true all-in cost-per-return by SKU and channel using the formula above. This tells you where to focus everything else.
- Days 1 to 30: exchange-first pilot. Turn on exchange-first for a single high-return category and track exchange conversion against a 25–40% target.
- Days 15 to 45: PDP content test. A/B test improved imagery, descriptions, and where relevant, a fit or room-visualisation tool on a subset of SKUs, then measure return-rate change against a control group.
- Days 20 to 60: 3PL negotiation. Push for a 48-hour receiving SLA and grading-photo-on-receipt as standard contract terms, not a favour.
Pro Tip: Run the cost audit first even if it delays the other pilots by a week. Without it, you'll optimise the wrong SKUs and waste the 60 days.
Which data sources and tools actually make returns analysis possible?
Returns data lives in at least four disconnected systems for most retailers: the storefront platform, the order management or ERP system, the 3PL's warehouse management software, and whatever helpdesk tool handles customer return requests. Analysis breaks down when these don't talk to each other, because the reason code a customer gives at the portal stage rarely makes it into the grading data captured at the warehouse.
The minimum viable integration links reason codes at the point of return initiation to the disposition grade assigned at receiving, and both to the original order record including cost of goods and shipping method. Without that chain, you can report a return rate but not a root cause, and root cause is what drives prevention spend decisions.
Practically, this means exporting return reason codes, SKU-level return rates, and grading outcomes into a single warehouse or spreadsheet model at least weekly, rather than relying on whatever native reporting your ecommerce platform or 3PL provides out of the box. Most platform dashboards report gross return counts well but rarely surface cohort-matched rates or all-in cost, so a lightweight data model built in a BI tool or even a well-structured spreadsheet often outperforms the built-in reporting for genuine returns management in ecommerce. Keyword-level product page performance also belongs in this data set. If a SKU's returns spike alongside a traffic surge from a specific search term or campaign, that's a signal the product page copy or targeting is setting the wrong expectation before the sale even happens.
Can predictive models actually forecast which orders will come back?
Analysing return rates in hindsight tells you what happened. Predictive modelling tells you which orders are likely to come back before they ship, which changes what you can do about it.
The features that predict returns most reliably tend to be mundane: order history (has this customer returned before, and how often), basket composition (multiple sizes or colours of the same item is a strong bracketing signal), category and price point, and time-of-day or campaign source. A logistic regression or gradient-boosted model trained on these features can score incoming orders for return probability, and that score can trigger different treatment: a slower, cheaper shipping method for high-risk orders, a size-confirmation prompt at checkout, or exclusion from aggressive promotional bundling that tends to inflate bracketing behaviour.
Machine learning earns its place mainly in high-volume categories where the training data is rich enough to be reliable, apparel and footwear especially, where sizing uncertainty is the dominant driver. For lower-volume categories like furniture, a simpler rules-based flagging system (multiple similar SKUs in one order, first-time customer plus high basket value) often performs almost as well with far less engineering effort.
The prevention payoff compounds with forecasting.
How much do returns really cost beyond the refund itself?
The refund line on a P&L understates the damage. Reverse logistics, processing labour, and write-offs are the visible costs; the invisible ones are often larger.
Customer lifetime value takes a measurable hit from the returns experience itself, not just the return event. A customer who has a smooth, fast exchange tends to reorder; one who fights a clunky returns process for a refund is meaningfully less likely to return to the store at all, regardless of whether the original product issue was the retailer's fault. This means the returns reserve calculation covered earlier is actually conservative: it captures the direct financial write-off but not the second-order revenue loss from a damaged relationship.
Brand reputation compounds this in ways that are hard to model precisely but impossible to ignore. Return experience shows up disproportionately in public reviews, both good and bad, because a bad returns experience is memorable in a way a smooth purchase rarely is. A retailer with a generous, fast exchange policy and clear sizing guidance builds a reputation that reduces pre-purchase hesitation across the whole catalogue, not just on the SKUs the policy directly touches.
There's also a working-capital cost that rarely appears in standard reporting. Inventory tied up in transit or awaiting grading is cash that isn't earning anywhere else, and the longer the time-to-restock, the more capital sits idle. A retailer with a 10-day average TTR effectively locks up ten days of returned inventory value at any given moment, compared to a competitor running a 3-day TTR through a tighter grading and routing process. Over a full year, that gap in working capital efficiency can be larger than the direct cost-per-return most retailers focus their attention on.
How can retailers turn returned stock into revenue, not just recovered cost?
Grade B, C, and D inventory doesn't have to mean liquidation at pennies on the dollar. The channel choice for each grade determines whether returned stock becomes a minor recovery or a genuine secondary revenue stream.
Managed resale programmes, where a retailer lists graded returns through its own storefront as "open box" or "certified refurbished," typically recover more per unit than wholesale liquidation because the retailer keeps the customer relationship and margin that would otherwise go to a liquidator. B2B auction platforms work well for bulk Grade C and D inventory where the volume doesn't justify the labour of individual relisting, trading some per-unit value for speed and lower handling cost.
Certified refurbishment partnerships matter most in categories with genuine repair value: electronics, appliances, and furniture with replaceable components all support cost-effective refurbishment where apparel generally doesn't. For furniture specifically, a returned sofa with a damaged panel or scratched finish is often a refurbishment candidate rather than a write-off, since the core structure retains most of its value even when the surface doesn't.

Donation partnerships close the loop for genuinely non-resaleable stock, and the tax treatment in many jurisdictions makes donation financially comparable to a low-value liquidation sale, without the reputational and environmental downside of landfill disposal. Recycling partnerships for materials that can't be donated, particularly in textiles and electronics, round out the disposition ladder so that almost nothing in Grade D ends up simply discarded.
Cross-border retailers get an additional lever here: routing international returns through regional consolidation hubs rather than single-label international shipments cuts reverse-shipping cost substantially, which changes the economics of which recovery channel makes sense for a given SKU.
What do successful returns programmes actually look like in practice?
The pattern across well-run returns programmes isn't a single silver-bullet fix. It's several moderate levers running at once, each contributing a few percentage points, that together add up to a meaningfully lower return rate and a materially better recovery rate on the returns that still happen.
Improving sizing charts and adding a fit-comparison tool on those SKUs, combined with switching the default return flow to exchange-first, tends to move the needle within one quarter, consistent with the 20–35% conversion-to-exchange range reported across implemented playbooks.
A home and furniture retailer facing "not as pictured" complaints follows a different sequence: PDP content and visualisation fixes come first, because the return driver is expectation mismatch rather than fit uncertainty, and the unit economics of furniture returns (higher shipping cost, lower restock speed) make prevention far more valuable than fast disposition. The programmes that see the clearest results treat prevention and recovery as parallel workstreams from day one, rather than fixing the front end and only later building out grading and routing, because the returns that still happen while prevention efforts ramp up need somewhere productive to go in the meantime.
Why returns need a named owner, not a shared responsibility
Returns analysis fails most often not from bad data but from no one owning the weekly number. A returns scorecard reviewed jointly by operations, finance, and merchandising, covering gross and net return rate, exchange conversion, TTR, and recovery rate, turns scattered reporting into a decision-making rhythm.
Prevention and recovery have to run in parallel, not sequentially, because the returns that happen while you're fixing PDP content still need somewhere productive to go. Treat that as a joint accountability, not two separate projects competing for the same budget cycle.
— Michael
Cut furniture returns before they happen with a room‑preview widget
Furniture retailers lose more to "I wasn't sure it would fit" than almost any other return reason, and that's exactly the expectation gap Aifurniture is built to close. Instead of asking shoppers to imagine a sofa in their lounge, the widget lets them upload a single photo of their own room and see the actual product composited into it within 30 seconds, using the product photos you already have rather than 3D models or an app download.
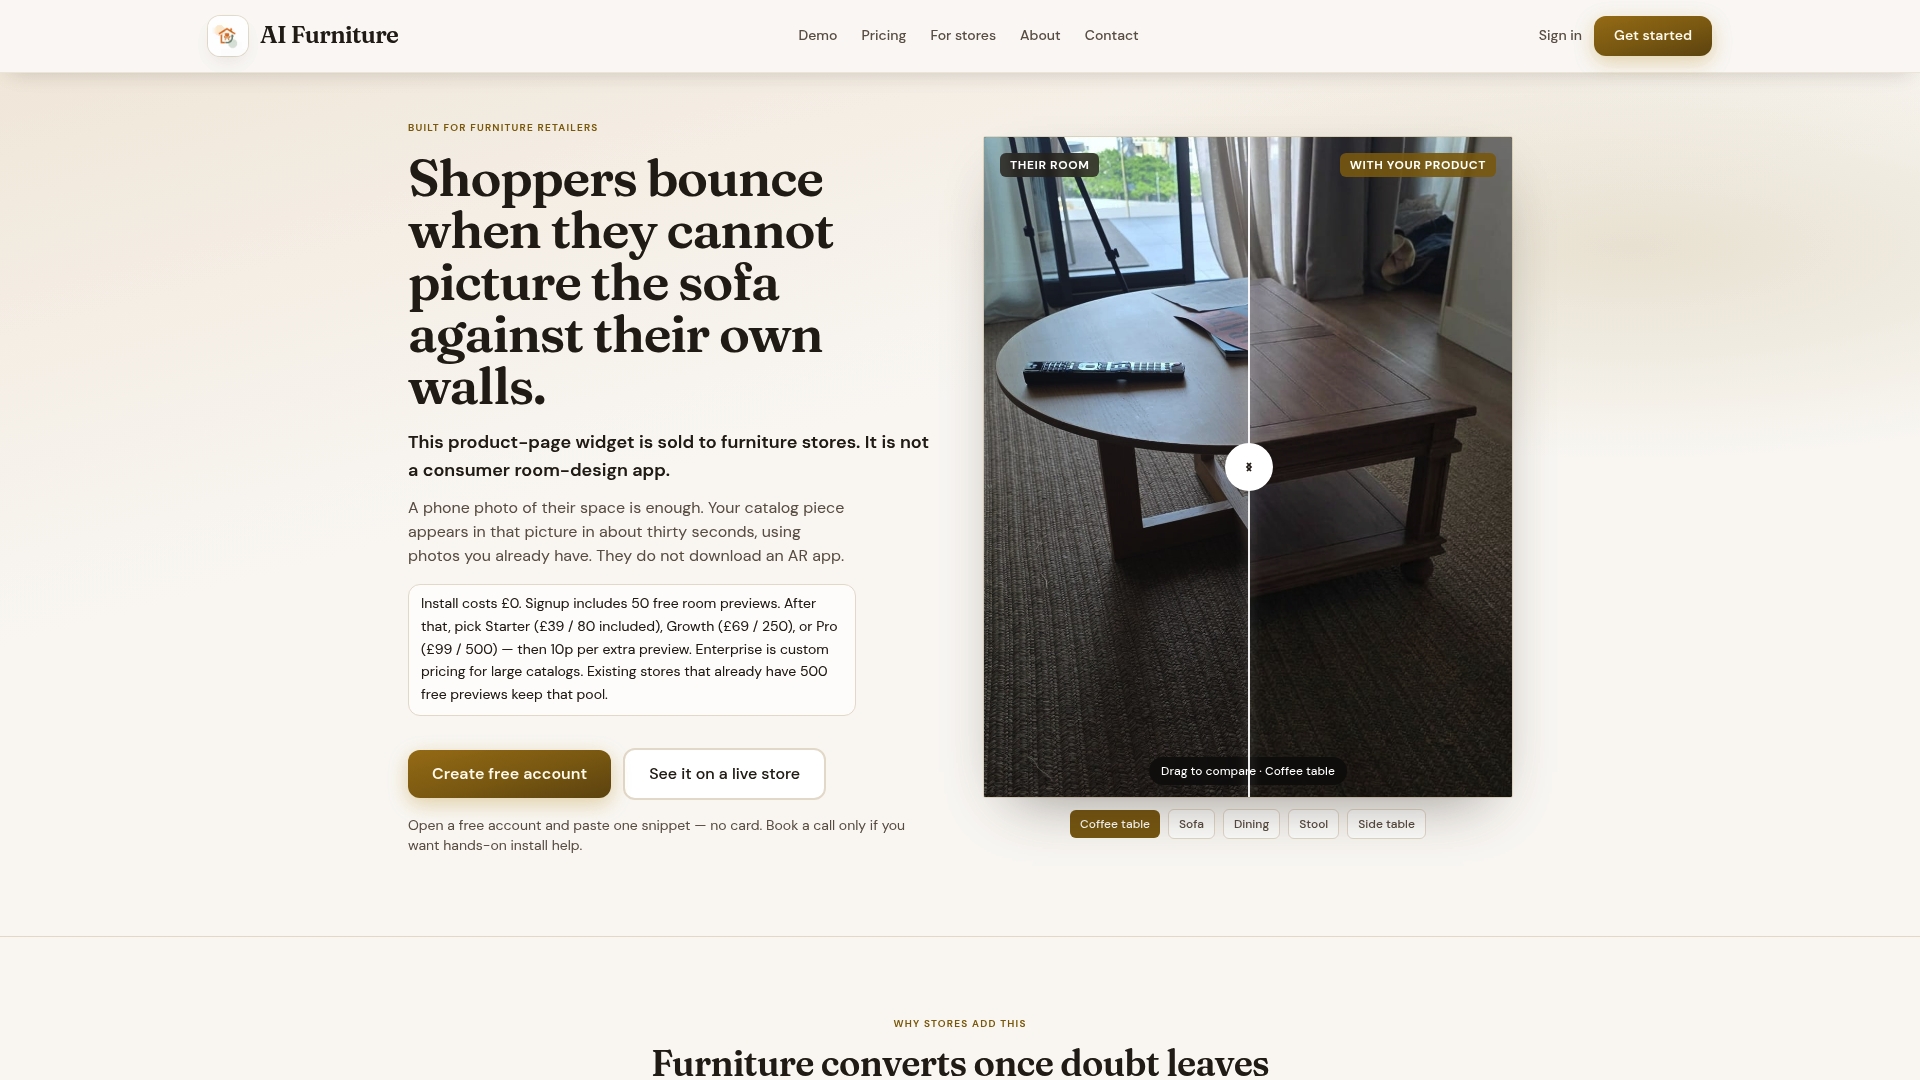
Retailers testing a room-preview tool often start with free previews to measure the effect before incurring costs, tracking impact on return rates, conversion, and exchange uptake in categories where visual mismatch is a key return driver. Run it as a genuine A/B test: enable the widget on a subset of high-return SKUs, leave a control group untouched, and compare return rates and conversion over a full sales cycle before drawing conclusions. If the numbers hold, paid usage runs from $52.56 a month on the Starter plan, with extra previews billed at 10p each beyond your plan's allowance, and integrates directly with Shopify, Magento, BigCommerce, WooCommerce, and custom storefronts. Start your free trial run on a live product page and see what it does to your return rate before committing to anything.
Sources
- Average ecommerce return rate 2026 (Eightx)
- How to build a resilient returns management system in 2026 (Ecommerce Times)
- Ecommerce returns reduction: a 2026 data-led playbook (DigitalApplied)
FAQ
What is a good ecommerce return rate to benchmark against?
It depends entirely on category: roughly 19–21% blended across ecommerce overall, with apparel running higher around 25% and furniture and electronics running lower at 15–20% and 10–11% respectively. Compare your rate against your own category range, not the blended average.
How do you calculate the true cost of a return?
Add reverse shipping, processing labour, repackaging, a probability-weighted write-off based on grading outcome, and the lost contribution margin from the original sale. This all-in figure typically lands well above the shipping cost alone, often in the $10 to $65 range depending on category.
Does offering exchanges actually reduce refund costs?
Yes. Around 60% of consumers accept an exchange or store credit over a refund when the process is fast, and merchants running exchange-first flows convert 25–40% of what would otherwise be refunds into retained revenue.
Can visualisation tools reduce furniture returns specifically?
Room-preview and visualisation tools address the "not as pictured" and fit-uncertainty causes that drive a large share of furniture returns, with targeted pilots reporting reductions in the 20–30% range. Aifurniture's widget applies this by compositing a retailer's own product photos into a shopper's uploaded room image, with a free preview offer available to test the effect before paying anything.
What does Aifurniture cost after the free previews?
Paid plans start at $52.56 per month on the Starter tier, with Growth and Pro tiers available at higher preview volumes and Enterprise pricing available on request. Extra previews beyond a plan's allowance are billed at 10p each with no setup fee.