
Measure a room preview trial with four core metrics: preview engagement, add-to-cart lift, conversion lift and change in return rate, all tracked through GA4 ecommerce events inside a controlled A/B test. Run the test against a fixed supply of free previews, such as 500 free previews, so the trial has clear boundaries before it becomes a paid rollout decision.
TL;DR:
- A minimum of 500 free previews is necessary to identify statistically significant lift in conversion rate and downstream revenue.
- Tracking both standard GA4 ecommerce events and custom preview-specific events ensures accurate attribution and funnel analysis.
- Segmenting results by device, price band, and shopper status helps understand where the preview has the most impact.
- Running a QA pilot and verifying event data before full launch prevents data disputes and improves trial reliability.
- Use a control group for valid comparison, and wait 30 to 90 days post-purchase to assess the trial's effect on return rates.
Table of Contents
- Objectives and success criteria for the free preview trial
- Which metrics and events to track
- Implementation checklist and QA before launch
- Designing the experiment: control, treatment and sample size
- Analysing results and handling attribution
- Deciding whether to scale, and what to test next
- What experience with visualisation tools tells us
- Why most trial plans measure the wrong thing first
- Try the widget: 500 free previews and next steps
- Sources
- FAQ
Objectives and success criteria for the free preview trial
The trial exists to answer one question: does letting shoppers preview furniture in their own room change buying behaviour enough to justify paying for it. That means setting a primary KPI and a threshold before the trial starts, not after the results come in.
The primary KPI is conversion rate lift between the treatment group (shown the preview) and the control group (not shown it). A reasonable bar is a relative increase the finance team would accept given preview costs and margins, for instance a lift large enough to cover the cost of extra previews once the free allowance runs out.
Secondary KPIs give texture to that headline number:
- Preview interaction rate: the share of product-page visitors who open the preview.
- Add-to-cart lift: the difference in add-to-cart rate between treatment and control.
- Average order value and revenue per visit across both groups.
- Change in return rate measured over 30 to 90 days after purchase.
Set thresholds relative to your own margin and preview cost, not a borrowed industry number.
Which metrics and events to track
Track this with standard GA4 ecommerce events plus a small set of custom events that describe what happens inside the preview widget itself. The GA4 ecommerce measurement guide recommends view_item_list, view_item, add_to_cart, begin_checkout and purchase as the core set, alongside refund where relevant.
Layer custom events on top so the preview's contribution is visible inside that funnel rather than hidden inside it:
- preview_open: fires when a shopper launches the room preview.
- preview_composite_success: fires when the composite image renders successfully.
- preview_interaction_time: captures how long a shopper stays engaged with the result.
- preview_added_to_cart: fires when a shopper adds an item to cart directly from the preview screen.
Every event needs consistent item parameters, item_id, price and currency, set the same way across the catalogue, or the funnel breaks the moment two teams name things differently. If the preview is promoted through banners or on-site slots, the same GA4 guidance covers view_promotion and select_promotion events worth adding to the same property.
Pro Tip: Name custom events with the same prefix and casing everywhere in the codebase, since a mismatched preview_Open versus preview_open silently splits your funnel data in two.
Implementation checklist and QA before launch
Before any shopper sees the treatment version, run through a short technical checklist so the data you collect during the trial can actually be trusted.
- Install and verify the Google tag on every page that will carry the trial, confirming the GA4 property receives standard pageviews first.
- Enable DebugView and use debug mode to watch events fire in real time as you click through the preview yourself, since standard GA4 reports can take up to 24 hours to populate, which is too slow for launch-day troubleshooting.
- Run a small QA pilot of 50 to 100 previews before the full trial opens, checking that preview_open, preview_composite_success and the downstream add_to_cart and purchase events all attribute to the same session.
- Confirm currency and item fields are populated correctly on every event, check you are within GA4's custom dimension and metric limits, and write a short runbook describing what a broken event looks like in DebugView.
Skipping this step is the most common reason a trial's numbers get disputed after the fact.
Designing the experiment: control, treatment and sample size
Randomise visitors into two groups: a control group that sees the product page as usual, and a treatment group that sees the room preview widget. Session-level randomisation is often more reliable than user-level randomisation when login state is inconsistent across devices.
Before launch, estimate the sample size needed to detect your target lift given your current baseline conversion rate. A smaller minimum detectable effect needs a larger sample, and with a hard cap such as 500 free previews, that ceiling may limit how confidently you can call a small lift statistically real rather than noise.
Some practical design choices:
- Run the trial for at least four to six weeks to capture a full buying cycle and allow time to observe returns.
- Segment results by device, since mobile and desktop shoppers often behave differently around imagery.
- Segment by price band, since a preview may matter more on a £1,200 sofa than a £40 side table.
- Segment new versus returning shoppers, since returning shoppers may already trust the product without a preview.
Treat the 500-preview cap as a constraint to plan around, not a target to exhaust in the first week.
Analysing results and handling attribution
Once the trial closes, calculate the conversion rate difference between treatment and control along with confidence intervals, not just a single headline percentage. Do the same for average order value and revenue per visit, and report incremental revenue per preview used so the cost of the trial can be weighed against what it generated.
One AR-linked visualisation trial reported a conversion lift of 112% and a revenue-per-visit lift of 106% for shoppers who interacted with 3D or AR assets versus those who did not, according to DFS's reported results with an AR partner. That figure comes from a different visualisation technology and a different retailer, so treat it as context for how large an effect immersive previews can produce, not as a benchmark your own trial must match.
A few checks matter before you trust the headline number:
- Run an attribution sensitivity check: last non-direct click as your baseline, then compare against linear and first-click models using Shopify's marketing reports.
- Control for confounders such as concurrent promotions or seasonal demand swings that could inflate either group.
- Hold judgement on return-rate impact until you have 30 to 90 days of post-purchase data, since returns lag purchases by weeks.
Deciding whether to scale, and what to test next
Compare the trial's results against the thresholds you set at the start. If conversion lift, add-to-cart lift and return-rate change all clear their bars, forecast the return on investment at full catalogue scale and move towards a paid plan. If results fall short, treat that as information about placement or execution rather than a verdict on the concept itself.
Before abandoning the idea, iterate on a few cheap variables:
- Test where the preview button sits on the product page and how prominent it is.
- Test the call-to-action wording that invites shoppers to try the preview.
- Test merchandising choices, such as which SKUs get the preview treatment first.
- Keep monitoring return rates for a further cycle even after scaling, since early results can shift.
Weigh marginal revenue per preview against the per-preview cost once you move past the free allowance, since that comparison, not the raw lift number alone, is what should decide the pricing tier you choose.
What experience with visualisation tools tells us
Shoppers hesitate to buy furniture online for a specific, well-documented reason: it is hard to judge scale and fit from photos and a tape measure alone. Baymard's research on product dimensions and sizing finds that shoppers struggle to translate written measurements into a real sense of how something will look in their space, and that uncertainty is a quiet but persistent driver of both abandoned carts and returns.

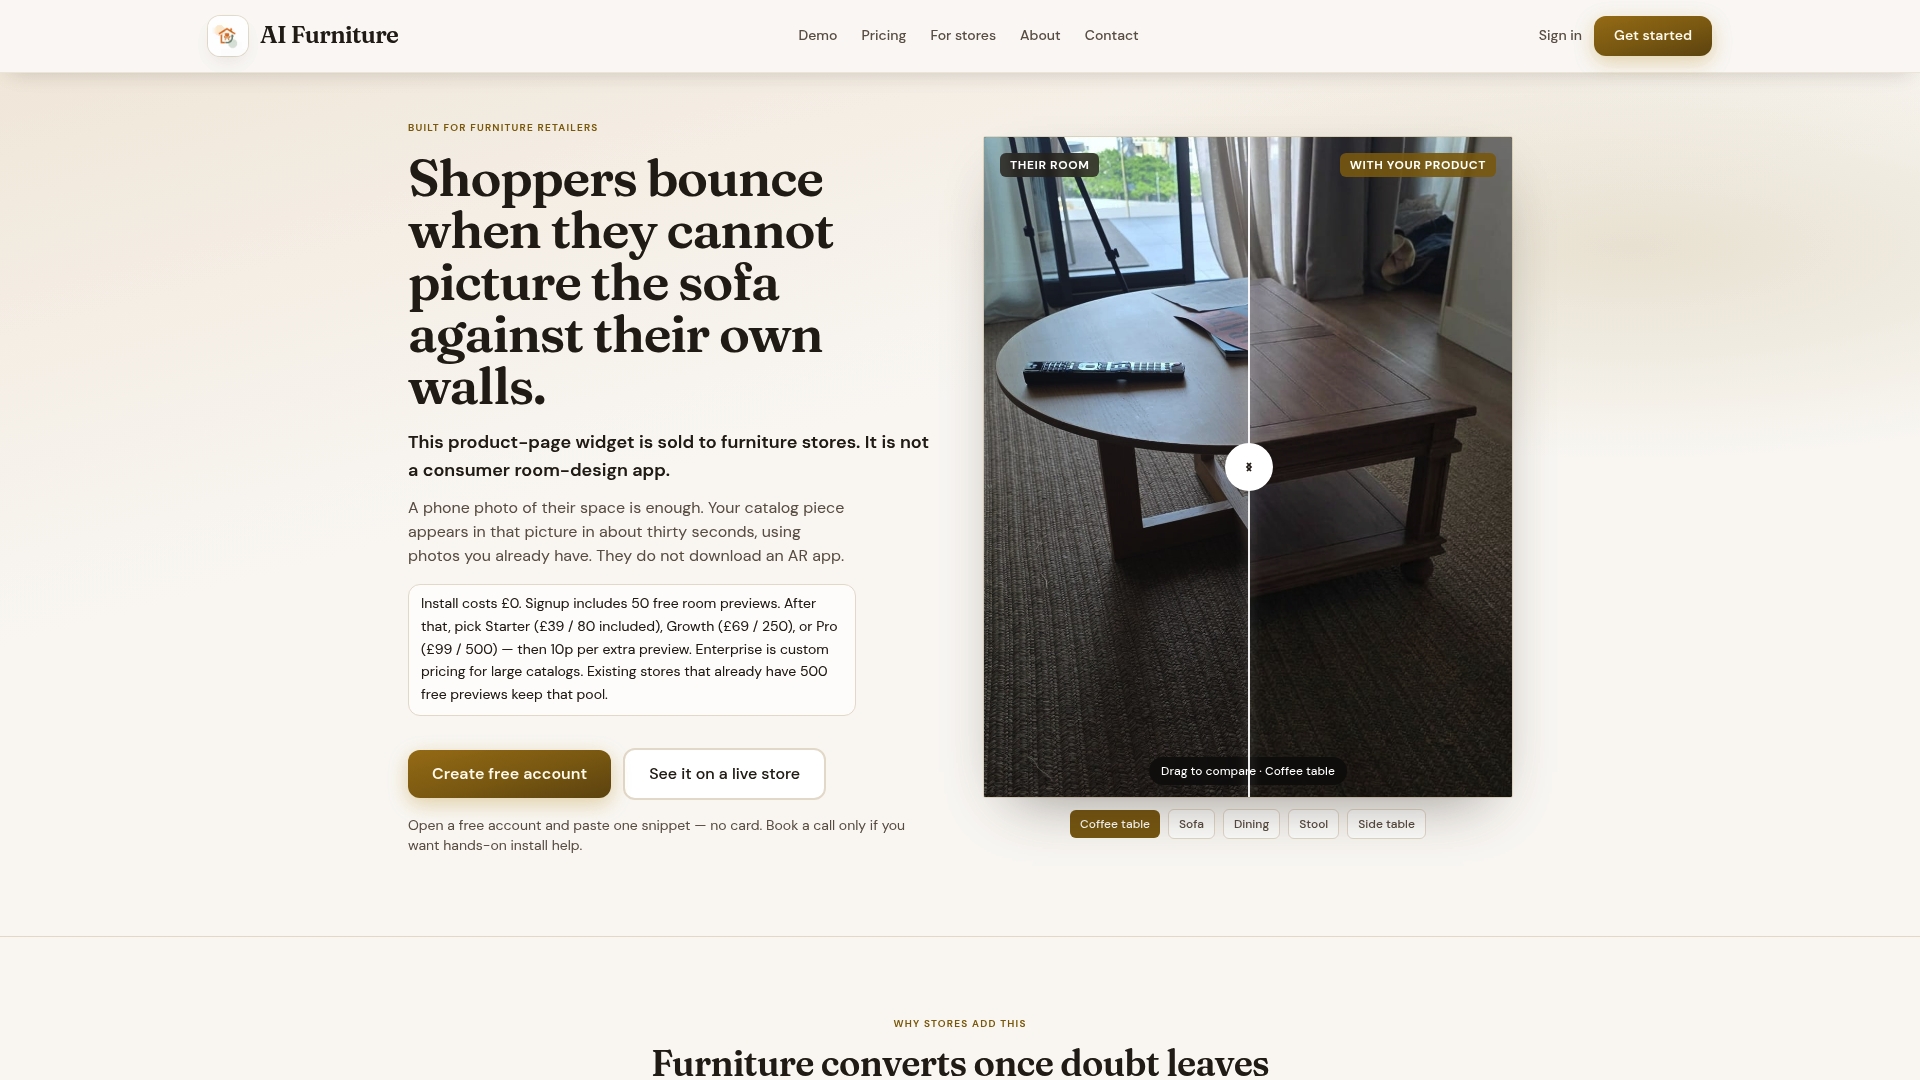
AI Furniture Solutions built its room preview widget around that specific problem. A shopper uploads a photo of their own room, and within 30 seconds the retailer's product appears composited into that photo, with no app download required. Because the approach relies on photo compositing rather than 3D modelling, it works with the product photography retailers already have, which is part of why it reduces returns tied to fit and style uncertainty.
Retailers can test this without commitment through a free preview allowance before any billing begins, which is the same free allowance this evaluation plan is built to measure.
— Michael
Why most trial plans measure the wrong thing first
Most guidance on running a feature trial jumps straight to statistical significance and skips the more basic failure point: teams often launch without agreeing what counts as success, so every result gets argued over after the fact rather than judged against a standard set in advance.
The bigger mistake I see is treating the preview as a marketing gimmick to be judged on vanity engagement, when Baymard's research points at something more specific: shoppers are trying to resolve a real question about scale and fit, and a preview only earns its keep if it resolves that question. That is why preview interaction time and downstream add-to-cart behaviour matter more than a raw open count.
Prioritise the QA pilot before anything else. A trial built on broken event tracking cannot be salvaged by clever statistics afterwards, and a 500-preview allowance leaves little room to waste on data you cannot trust.
Try the widget: 500 free previews and next steps
Running this evaluation plan does not require committing to a paid contract first. AI Furniture Solutions gives every new retailer 500 free previews to test against exactly the KPIs outlined above, using your own product photos with no 3D modelling and no app for shoppers to download.
To get started:
- Run the QA pilot on a small batch before opening the trial to full traffic.
- Enable GA4 debug mode and confirm your event map before the trial clock starts.
- Request a demo on your own product pages or check current plans and pricing to see where the free allowance fits your catalogue.
Sources
Consult these for implementation details beyond what fits in a single article:
- Dimensions, measurements, and product size — Baymard
- Measure ecommerce — Google Developers
- GA4 Set up ecommerce events - Analytics Help
FAQ
How many previews do I need for a reliable trial?
There is no fixed number that works for every catalogue, since it depends on your baseline conversion rate and the size of the lift you want to detect. A 500-preview allowance is often enough for an initial signal, though a small lift may need more volume before you can trust it statistically.
Which GA4 events should I set up first?
Start with the standard set, view_item, add_to_cart, begin_checkout and purchase, since GA4's ecommerce guidance treats these as the core funnel. Add custom preview events such as preview_open and preview_added_to_cart once the standard events are verified in DebugView.
How long should I wait before judging the return rate?
Wait 30 to 90 days after purchase before drawing conclusions about return rate, since returns typically lag the original sale. Judging the trial before that window closes risks calling a false positive on a metric that has not fully materialised yet.
Should preview users be included in remarketing campaigns?
Yes, provided your consent and privacy settings allow it, since shoppers who engaged with the preview but did not buy are a reasonable remarketing segment. Keep this group separate in your reporting so remarketing-driven purchases do not get mistaken for organic trial lift.
Do I need a control group, or can I just watch overall sales change?
A control group is what makes the result trustworthy, since overall sales can shift for reasons that have nothing to do with the preview, such as seasonality or a promotion running at the same time. Comparing treatment against a proper control, as described in Shopify's marketing reports guidance on attribution, is what lets you separate the preview's effect from everything else happening at once.