
If you run a room-preview widget on your furniture site, three things matter above everything else: accurate preview usage counts, conversion lift broken down by product size and SKU, and a billing trail you can audit end to end. Lift is strongest on bulky, spatially uncertain pieces, and billing only works when you have defined what counts as a billable preview. A free trial allowance is the lowest-risk way to test all three before committing budget.
TL;DR:
- Preview counts should be tracked at the event level, including unique users, product-specific preview rate, and quality indicators like render time and retakes.
- Conversion lift measurements must be segmented by SKU size and device to accurately assess the impact on bulky, high-risk furniture items.
- Billing should be based on clearly defined, logged, and auditable events, including all attempts, successes, failures, and a billing flag to allow proper reconciliation.
- Dashboards need operational, financial, and analytical views separately, with projections visible to foster transparency and trust in a usage-based billing model.
- Testing should begin with free previews, focusing on metrics such as size-based lift, billing accuracy, and user engagement with dimensions, before scaling to paid tiers.
Table of Contents
- Which preview usage metrics to track and why they matter
- Measuring conversion lift: segmentation, tests and interpretation
- Usage-based billing and metering best practice for a room-preview service
- Dashboard and report design: fields, exports and analytical views
- Integration and rollout checklist (platforms, event schema, privacy and pilot)
- Author perspective: three practical takeaways and where to start
- How AI Furniture Solutions helps you track and bill for previews
- FAQ
- Sources
Which preview usage metrics to track and why they matter
Preview usage data is only useful when it is specific enough to act on. A single "previews this month" number tells you almost nothing about which products need attention or whether shoppers trust what they see.
Track these at the event level, not just as a monthly total:
- Preview count and unique preview users, separated so you can tell repeat testing from genuine reach.
- Preview rate per product page, which flags underused PDPs worth investigating.
- Top previewed SKUs, which tells merchandising where visual confidence is being built or questioned.
- Completion rate, render time and retake frequency, which expose quality problems before they show up as refunds.
These numbers feed three different teams. Merchandising uses top-previewed SKUs to decide which products need better lifestyle photography. Returns teams watch completion and retake rates as an early signal that a product's dimensions or finish are unclear. Product content teams use low preview rates per PDP to spot pages missing a clean background photo the widget can composite against.
A key diagnostic is whether preview users also check dimensions. Baymard's 2026 furniture UX research found written dimensions were essential to fit confidence for 49% of surveyed shoppers, and dimension images for 42%. That means a dashboard showing preview counts alone misses half the picture: furniture evaluation is multimodal, and tracking whether preview users also open the dimensions tab tells you if visualisation is replacing or reinforcing measurement-based confidence.

Measuring conversion lift: segmentation, tests and interpretation
Store-wide averages hide where a room-preview widget actually earns its keep. A sofa and a side table carry completely different spatial risk, and lumping them together washes out the signal.
- Run A/B tests or matched comparisons rather than before-and-after comparisons on the same traffic.
- Report lift by SKU size or spatial-risk bucket, not as one blended percentage.
- Segment by device, traffic source, and new versus returning shopper, since each behaves differently around visualisation tools.
- Track previewed SKU conversion rate, previewed order value, and return-rate differences between previewed and non-previewed purchases.
A 2025 furniture shopping trends study found a positive and significant sales effect from AR enablement, with the effect stronger for larger products. That is the practical case for size-bucketed reporting: a widget might show flat lift on small accessories while driving a meaningful shift on bulky, high-consideration pieces, and a single blended number would never reveal that.
Pro Tip: Treat every lift figure as directional until you have run the same segment comparison across at least two sales cycles; a single month can be skewed by a promotion or a seasonal spike.
Academic research on spatial fit uncertainty backs the same pattern: visualisation tools improve spatial evaluation most where the product is large and the risk of misjudging fit is high. Build your reporting around that distinction from day one rather than retrofitting it later.
Usage-based billing and metering best practice for a room-preview service
Billing disputes almost always trace back to a vague definition of what counts as a billable event. Fix that before you fix anything else.
- Define the billable unit explicitly, for example one successfully delivered preview, and separate it from attempted, failed or retried renders.
- Log an auditable record per event: store or retailer ID, SKU, timestamp, request or session ID, status, and a billing flag.
- Aggregate events into a meter, then rate that meter against the plan, then generate the invoice line item, following the meter-to-invoice flow set out in Stripe's billing meter event documentation.
- Offer prepaid allowances with clear overage rules rather than opaque flat fees, so finance teams can forecast spend.
| Field | Purpose |
|---|---|
| Store/retailer ID | Links usage to the correct account |
| SKU | Identifies which product generated the preview |
| Timestamp | Orders events for billing periods |
| Request/session ID | Prevents duplicate billing on retries |
| Status | Attempted, failed or delivered |
| Billing flag | Marks whether the event is billable |
Keeping attempted and failed events in the log, even when they are not billed, is what lets finance reconcile a dashboard total with an invoice without guessing.
Dashboard and report design: fields, exports and analytical views
A dashboard earns its place when product teams and finance can both read it without calling an analyst. That means separating operational, financial and analytical views instead of cramming everything into one screen.
- Operational view: live preview counts, success and failure rates, top previewed SKUs, preview rate per PDP, and device split.
- Finance view: current period usage, allowance remaining, projected month-end usage, and an invoice preview.
- Analytical reports: lift by SKU size, the preview-to-add-to-cart funnel, cohort comparisons of new versus returning shoppers, and return-rate differences.
- Exports in CSV or JSON with a stated retention policy, so finance can reconcile against invoices during an audit.
Stripe's usage-based pricing guidance recommends naming the metric, the per-unit rate and offering an estimator, because unpredictable usage otherwise creates budget anxiety for the buyer. A projected month-end figure next to the current allowance does exactly that job inside the dashboard rather than leaving it to a support ticket.
Pro Tip: Put the invoice preview on the same screen as current usage; separating them is the single most common reason finance teams distrust a usage-based bill.
Integration and rollout checklist (platforms, event schema, privacy and pilot)
Rolling out a preview widget touches engineering, merchandising and finance at once, so sequence matters.
- Confirm platform hooks and SKU mapping for Shopify, Magento, BigCommerce, WooCommerce or a custom storefront before launch.
- Define the event schema: required fields, idempotency keys to stop duplicate billing, retry handling, and a clear flag for billable versus non-billable events.
- Set privacy rules for uploaded room photos, including retention windows and consent language where your market requires it.
- Pilot on the free allowance first: use the 500 free previews to run SKU-segmented tests, validate the billing estimator against real usage, then scale to paid tiers.
Treat the pilot as a test of the whole pipeline, not just the visual feature. If the event log, the dashboard fields and the invoice estimator all hold up during 500 free previews, scaling to a paid plan is a pricing decision rather than an engineering risk.
Author perspective: three practical takeaways and where to start
Three things separate a widget that merely looks good from one that earns its cost: billing that matches an exact, logged definition of a preview; lift reported by product size rather than as one store-wide figure; and an invoice estimator shoppers' own finance teams can check before signing off. Start with the free previews, measure those three things, then decide.
— Michael
How AI Furniture Solutions helps you track and bill for previews
We build our widget around exact, logged events: every preview is tied to a SKU, a session and a status, so the usage data behind your bill is the same data your merchandising team sees. No 3D models or app downloads are needed, since we composite against the product photos retailers already have, and our 500 free previews give you a working pilot before any paid plan starts.
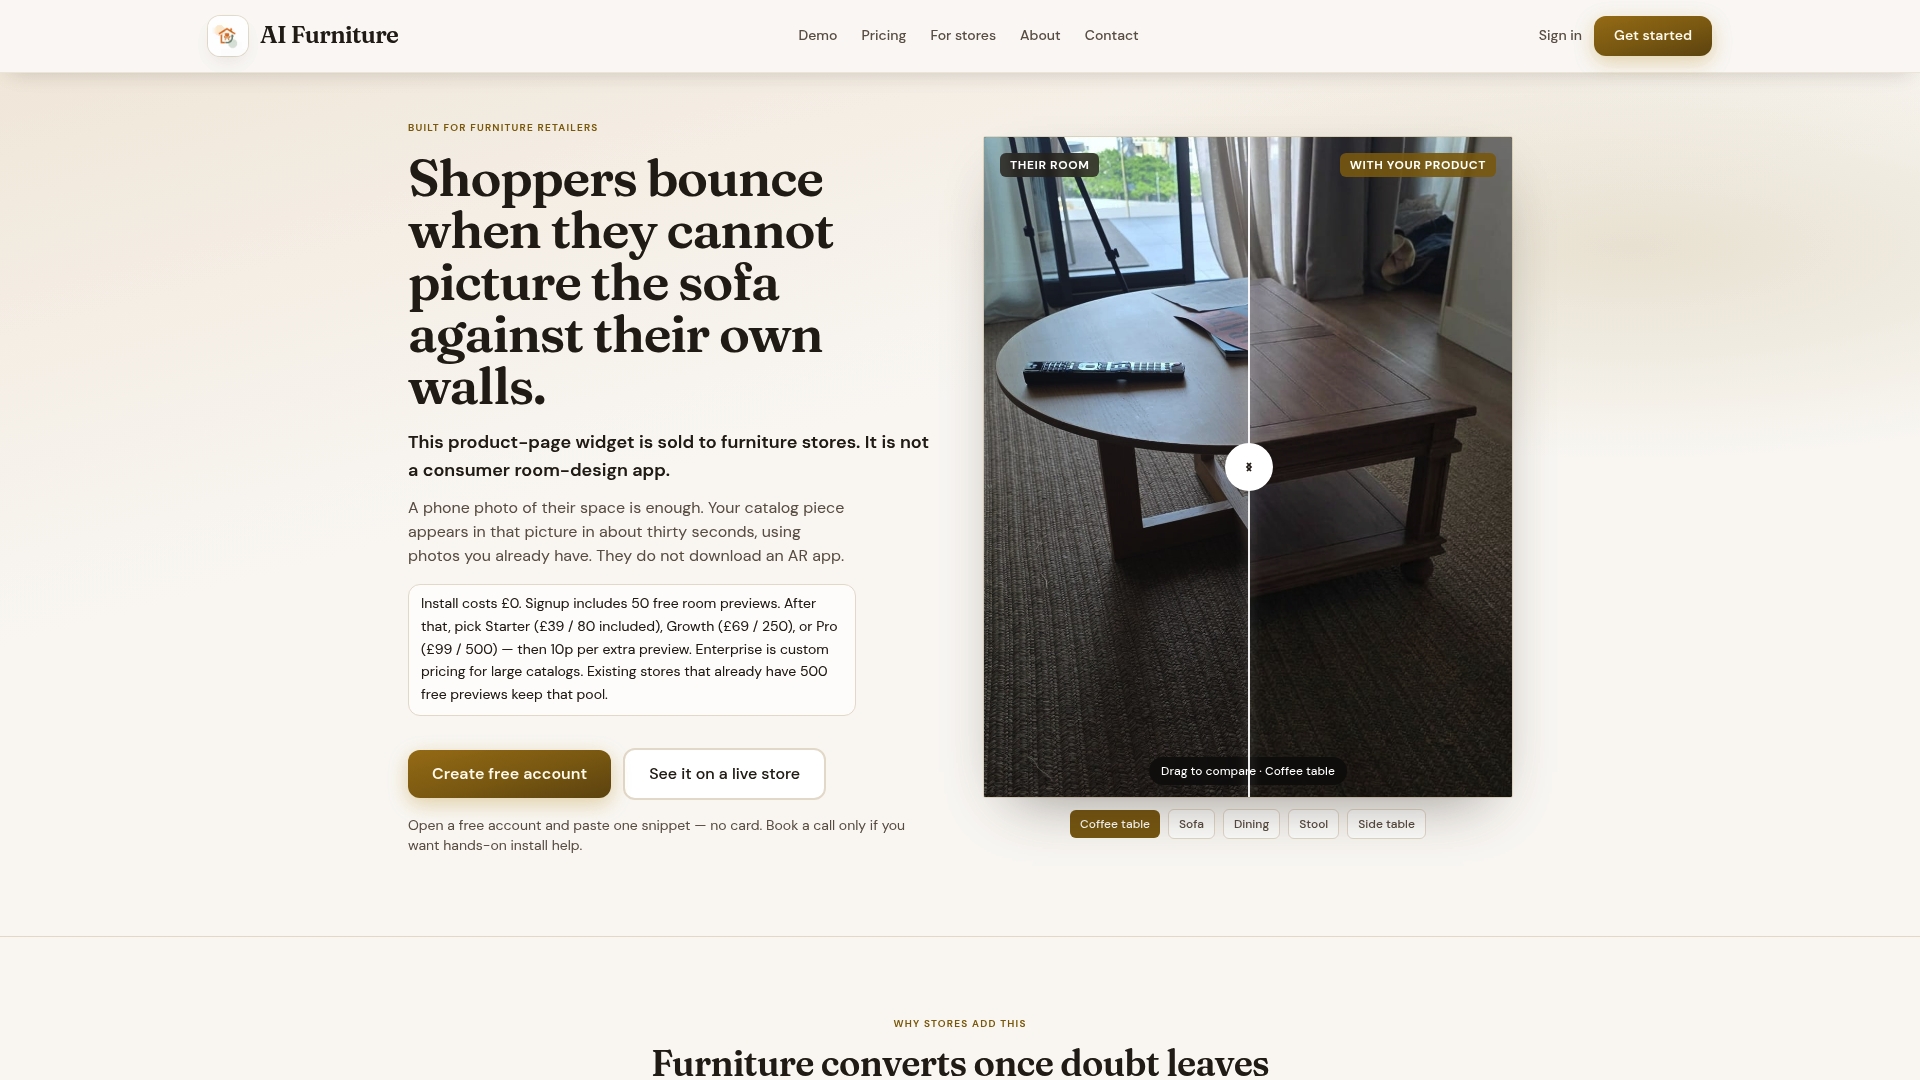
- Plans from £52.56 (Starter) to £133.42 (Pro) per month, each with a set preview allowance, listed on our pricing page.
- Extra previews are billed per preview at a fixed rate, with no setup fee, so overage costs stay predictable.
- Event exports support finance reconciliation from the first preview, not bolted on later.
Visualisation works alongside dimensions, not instead of them: we recommend keeping measurement content visible next to the preview widget rather than replacing it. If you want to see the integration on your own catalogue, book a launch call and we will walk through your platform and your billing estimator together.
FAQ
What counts as a billable preview event?
A billable preview is typically one successfully delivered room render shown to a shopper, distinct from attempted or failed renders that a well-built system logs but does not charge for. Keeping all three statuses in the event record is what lets finance reconcile the dashboard total against the invoice.
How should retailers measure conversion lift from a room-preview widget?
Lift should be measured through A/B tests or matched comparisons and reported by product size or spatial-risk bucket rather than as a single store-wide figure. Research on AR enablement found the sales effect is stronger for larger products, which is why blended averages understate the real impact on bulky SKUs.
Why do dimensions still matter if shoppers can preview the product?
Furniture evaluation is multimodal: Baymard's 2026 research found written dimensions were essential to fit confidence for 49% of shoppers and dimension images for 42%. A preview widget should sit alongside dimension content, not replace it, and dashboards should track whether preview users also check measurements.
How much does AI Furniture cost for a furniture retailer?
Plans run from £52.56 per month on Starter up to £133.42 per month on Pro, each including a set preview allowance, with Enterprise pricing available on request, as listed on our pricing page. Extra previews beyond the allowance bill per preview with no setup fee.
What data should be logged for each preview for audit purposes?
Each event should record the store or retailer ID, the SKU, a timestamp, a request or session ID, its status (attempted, failed or delivered) and a billing flag. This structure follows the meter event pattern described in Stripe's billing documentation and is what allows a dashboard total to match an invoice line item.
Sources
- Furniture & Home Decor quantitative UX insights 2026 – Baymard
- Customer journey insights from 2024 furniture shopping trends study
- Stripe API: billing meter events
- Usage‑based pricing strategy for SaaS | Stripe
- Augmented reality and spatial fit uncertainty in online retailing (Pfaff et al., 2025)