
Yes, ecommerce widgets can deliver positive ROI, but only when the incremental gross contribution they generate exceeds their full cost, and that is rarely true by default. The fastest way to check is to measure conversion lift among users actually exposed to the widget against a control group, convert that lift to gross margin, and see how many months it takes to recover the setup and running cost. If you cannot yet answer that question, the next step is setting up a proper holdout before you spend another pound on the tool.
TL;DR:
- Conversion rate lift from widgets must be measured with random holdout groups to accurately determine causality and avoid selection bias.
- ROI calculations should focus on incremental gross profit, considering coverage, impressions, and full implementation costs, not just attributed revenue.
- Smaller merchants can reliably test ROI through simple A/B experiments, holdouts, or matched-cohort comparisons, without needing advanced data science resources.
- Widget success depends on the category's main consumer hesitation, such as fit in furniture or trust in fashion, aligning KPIs with specific buying barriers.
- Continuous optimization through targeted eligibility, periodic retesting, and adjusting for cost changes improves widget ROI over time.
Table of Contents
- What widget ROI actually means and where merchants go wrong
- Which KPIs actually tell you if the widget is working
- Attribution and incrementality: telling cause from correlation
- Calculating ROI and payback with a worked example
- Testing methods that work without enterprise traffic
- The full cost picture most ROI claims leave out
- Furniture-specific factors that change the ROI equation
- A 90-day roadmap from zero to a decision
- How widget type changes the ROI equation
- How ROI differs across ecommerce categories
- Ways to keep improving ROI once the widget is live
- What a successful widget rollout looks like in practice
- Practical view from a product-and-merchant lens
- Try the widget on your own product pages before you commit
- Sources
- FAQ
What widget ROI actually means and where merchants go wrong
Widget ROI is not the revenue a vendor dashboard attributes to sessions that touched the widget. It is the incremental gross contribution the widget causes, minus its total cost, expressed as a percentage, alongside a payback period in months. Revenue and profit are different things: a widget can lift attributed revenue while losing money once you subtract cost of goods, so ROI should be measured as incremental profit or contribution, not raw revenue, converted using your gross margin.
Denominator choice matters more than most merchants realise. Are you measuring lift per visitor, per session, per order or per purchaser? Pick one, record it, and use it consistently across every report, because switching denominators mid-analysis is how a modest lift turns into a misleading headline. The most common vendor pitfall is extrapolating a small-sample lift, measured on a subset of traffic or products, to sitewide revenue without accounting for coverage or selection bias in who actually saw the widget.
Which KPIs actually tell you if the widget is working
Track a short list, not a dashboard full of vanity numbers. The primary metrics answer whether the widget causes more purchases; the secondary ones tell you whether those purchases are worth more over time.
- Conversion rate lift, measured as exposed group versus control group, is the primary signal of causal impact.
- Incremental revenue and revenue per visit convert that lift into money terms you can compare against cost.
- Average order value shifts show whether the widget changes basket size, not just conversion.
- Customer lifetime value and repeat-purchase rate capture whether the widget attracts better long-term customers.
- Return rate matters most for physical goods where fit or expectation mismatches drive refunds.
Operationally, track widget coverage (the share of eligible users who actually saw it), valid impression rate, and any load-time effect on the page. A Commerce ROI Dashboard approach converts conversion lift into incremental gross profit and payback, treating coverage and valid impressions as gating inputs rather than footnotes.
A widget that only reaches 40% of eligible traffic cannot be credited for 100% of a sitewide revenue change. That gap between coverage and attribution is where most inflated ROI claims come from.
Attribution and incrementality: telling cause from correlation
Standard attribution models, whether last-click or data-driven, assign credit to touchpoints based on rules, not causation. Attribution settings in Google Analytics affect how conversions are counted and credited, which means the same widget can look wildly more or less valuable depending on which model you have selected. Neither model tells you what would have happened without the widget.
That gap matters because widgets rarely reach every visitor evenly. Shoppers who opt into a feature, or who land on pages where it happens to be enabled, often differ from the average visitor already, which is selection bias, not lift.
- Randomised holdouts, where a fixed share of eligible traffic never sees the widget, give the cleanest causal read.
- Geo or cohort holdouts work when a full random split is not technically feasible.
- Split testing at the page or catalogue level isolates the widget's effect from other site changes running at the same time.
- A minimum sample size and test duration, agreed before launch, stop you from calling a result early on noise.
Think with Google's guidance shows incrementality experiments are increasingly accessible even for merchants without large testing budgets, which makes a proper holdout a realistic first step rather than an enterprise-only luxury.
Pro Tip: Freeze all other product-page changes during your test window, or you will not know whether the widget or the other change moved the numbers.
Calculating ROI and payback with a worked example
Two formulas do the heavy lifting. ROI equals (incremental gross contribution minus total cost) divided by total cost, times 100. Payback in months equals total implementation plus operating cost divided by monthly incremental contribution.
Here is an illustrative example with clearly invented inputs, not market figures: say a store gets 100,000 monthly product-page visits, a baseline conversion rate of 2%, a widget-driven lift of 0.3 percentage points, an average order value of £150, a gross margin of 40%, and a monthly widget cost of £500.

At those inputs, ROI comes out strongly positive and payback is fast. The result is most sensitive to two assumptions: the size of the conversion lift and the gross margin used to convert revenue into contribution. Halve either one and the payback period roughly doubles, so always run the low, base and high scenario together rather than trusting a single point estimate.
Testing methods that work without enterprise traffic
Smaller merchants do not need a data science team to get a directionally reliable answer.
- Run a straightforward A/B test on product pages, splitting traffic randomly between widget and no-widget versions.
- Hold out an entire product or category cohort from the widget while rolling it out elsewhere, if a true random split is not available on your platform.
- Use matched-cohort comparisons or synthetic controls when randomisation is not possible, pairing similar products or periods to estimate what would have happened anyway.
- Set a minimum sample size and test duration before you start, and treat a result that only shows up after peeking at the data early as noise, not a finding.
- Capture events with GA4, server-side feature flags, or your ecommerce platform's native experiment tools, so the exposed and control groups are tagged consistently from day one.
Formal geo-level incrementality experiments are worth graduating to once you have traffic to support them and a widget that has already cleared a smaller test.
The full cost picture most ROI claims leave out
Vendor case studies tend to quote the lift and skip the cost side. Build your business case with the complete picture.
- Setup fees, photography or creative production, and tagging work all add to upfront cost even when the software itself is cheap.
- Usage-based pricing, charged per preview or per impression, scales with traffic, so a widget that looks affordable at low volume can get expensive once it succeeds.
- Any added page weight or layout shift can slow load times and introduce friction that quietly erodes some of the conversion gain you are trying to measure.
- A widget that changes buying behaviour can also change returns volume and customer service ticket volume, in either direction, and both belong in the cost side of the ledger.
Furniture-specific factors that change the ROI equation
Furniture is a high-consideration purchase where shoppers hesitate mainly over fit, not price. Baymard's furniture research identifies dimension and fit confidence as key drivers of cart abandonment, and recommends clear dimensions images and fit cues on product pages to reduce it.
- A room-preview visualiser addresses that fit anxiety directly, which is a different value driver from a generic on-page widget.
- Only a portion of visitors will actually use a preview feature, so measure coverage honestly rather than assuming universal adoption.
- Track the change in fit-related returns and support contacts as a direct downstream signal, since reduced returns from better fit confidence changes the payback calculation materially.
- Repeat-purchase behaviour is worth watching too, since returning purchasers can generate disproportionate value relative to their share of visits in categories where trust compounds over multiple orders.
A widget that cuts fit-related returns by even a modest amount can outperform one that only lifts first-click conversion, because furniture returns carry shipping and restocking costs that erase margin fast.
A 90-day roadmap from zero to a decision
- Days 0 to 7: define your primary KPI and denominator, instrument the exposed and control events, and reserve a genuine holdout before the widget goes live everywhere.
- Weeks 2 to 6: run the experiment, check that sample sizes and data quality are holding up, and watch page-speed and UX metrics for side effects.
- Weeks 6 to 12: convert the measured lift into gross contribution, calculate ROI and payback, and run the sensitivity checks against your two most fragile assumptions.
- Decision gate: a clear pass means the payback period is short enough to scale rollout; a borderline result means iterate on placement, creative or eligibility rules before another test; a clear fail means retire the widget rather than keep paying for it on hope.
Pro Tip: Write your decision thresholds down before you see any data, or you will be tempted to move the goalposts once the numbers arrive.
How widget type changes the ROI equation
Not all widgets earn their keep the same way. A size or fit visualiser, a live chat prompt, an upsell carousel and a loyalty pop-up each pull a different lever, and each carries a different cost and risk profile.
Visual confidence tools, such as room previews or size guides, tend to work on the abandonment side of the funnel: they reduce hesitation and returns rather than creating new demand. Urgency and social-proof widgets, such as stock counters or review pop-ups, work on the conversion side but carry a higher risk of habituation, where returning shoppers start ignoring them once the novelty fades. Upsell and cross-sell widgets move average order value directly but can also depress conversion if they add friction at checkout.
The practical implication is that you should not apply the same test design or success threshold to every widget type. A visualiser's payback case rests heavily on returns and support cost reductions that only show up over weeks, while a checkout upsell's case shows up within the same session. Match your measurement window and your KPI weighting to the mechanism the widget actually uses, not to a generic conversion-lift template borrowed from a different tool.
How ROI differs across ecommerce categories
Furniture is not the only category where fit or trust anxiety drives widget value, but the mechanism varies enough that a blanket benchmark is not useful. Fashion and footwear widgets, such as size recommenders, tend to reduce returns in a similar way to furniture visualisers, because the core buyer hesitation is also about fit. Electronics and appliance widgets, such as compatibility checkers or bundle configurators, tend to lift average order value more than they cut returns, since the anxiety is about compatibility rather than physical fit. Beauty and consumables widgets, such as quizzes or subscription prompts, often move repeat-purchase rate and CLV more than first-order conversion, because the value compounds across multiple future orders rather than the first one.
The common thread is that every category needs its own primary metric, chosen to match where the buyer actually hesitates. A widget vendor's headline ROI figure from one category tells you very little about what to expect in another, which is exactly why running your own holdout test matters more than trusting a case study from an unrelated business.
Ways to keep improving ROI once the widget is live
A widget's ROI is not fixed at launch. Placement, eligibility rules and creative all move the number, often more than the underlying technology does.
Start by narrowing eligibility to the product pages or categories where the mechanism actually applies, rather than running the widget everywhere by default; a fit visualiser on a low-consideration accessory page dilutes your coverage metric without adding value. Revisit your test periodically rather than treating the first result as final, since seasonal demand, catalogue changes and even the widget's own novelty effect can shift the numbers over a few months. Watch the secondary metrics, particularly return rate and repeat-purchase rate, for slower-moving gains that a short conversion-lift test will miss entirely. Where a partner focus on customer retention tactics helps frame the CLV side of the model, use it to sanity-check whether your widget's downstream value is being counted at all, since a same-session conversion test structurally cannot see it.
Finally, retest after any material change to cost, whether that is a pricing tier change from the vendor or a jump in usage-based fees as your traffic grows. A widget that paid back in three months at low volume can look different once metered charges scale with success.

What a successful widget rollout looks like in practice
The pattern in successful rollouts is consistent even when the widget itself varies: a defined control group, a margin-adjusted ROI figure rather than a raw revenue number, and a willingness to retire the tool if the holdout test does not support it. Merchants who report the strongest outcomes tend to be the ones who ran a real experiment before scaling, not the ones who trusted a vendor's aggregate case study from a different catalogue and margin structure.
The opposite pattern also holds: rollouts that skip the holdout step and go straight to sitewide deployment based on a vendor's small pilot numbers tend to discover the gap later, once a genuine control period finally gets run and the lift turns out to be smaller than assumed, sometimes because the pilot audience was more engaged shoppers to begin with. That is the selection bias problem again, and it shows up in case after case regardless of the widget category.
The practical takeaway is that the roadmap in this article, not any single vendor's number, is what determines whether a widget rollout counts as a success on your own books.
Practical view from a product-and-merchant lens
Photo-compositing visualisers can carry real leverage for furniture retailers precisely because fit anxiety, not price, is the main thing stopping a sale. That said, treat every vendor number, including ours, as a hypothesis to test against your own traffic and margin, never as a given.
— Michael
Try the widget on your own product pages before you commit
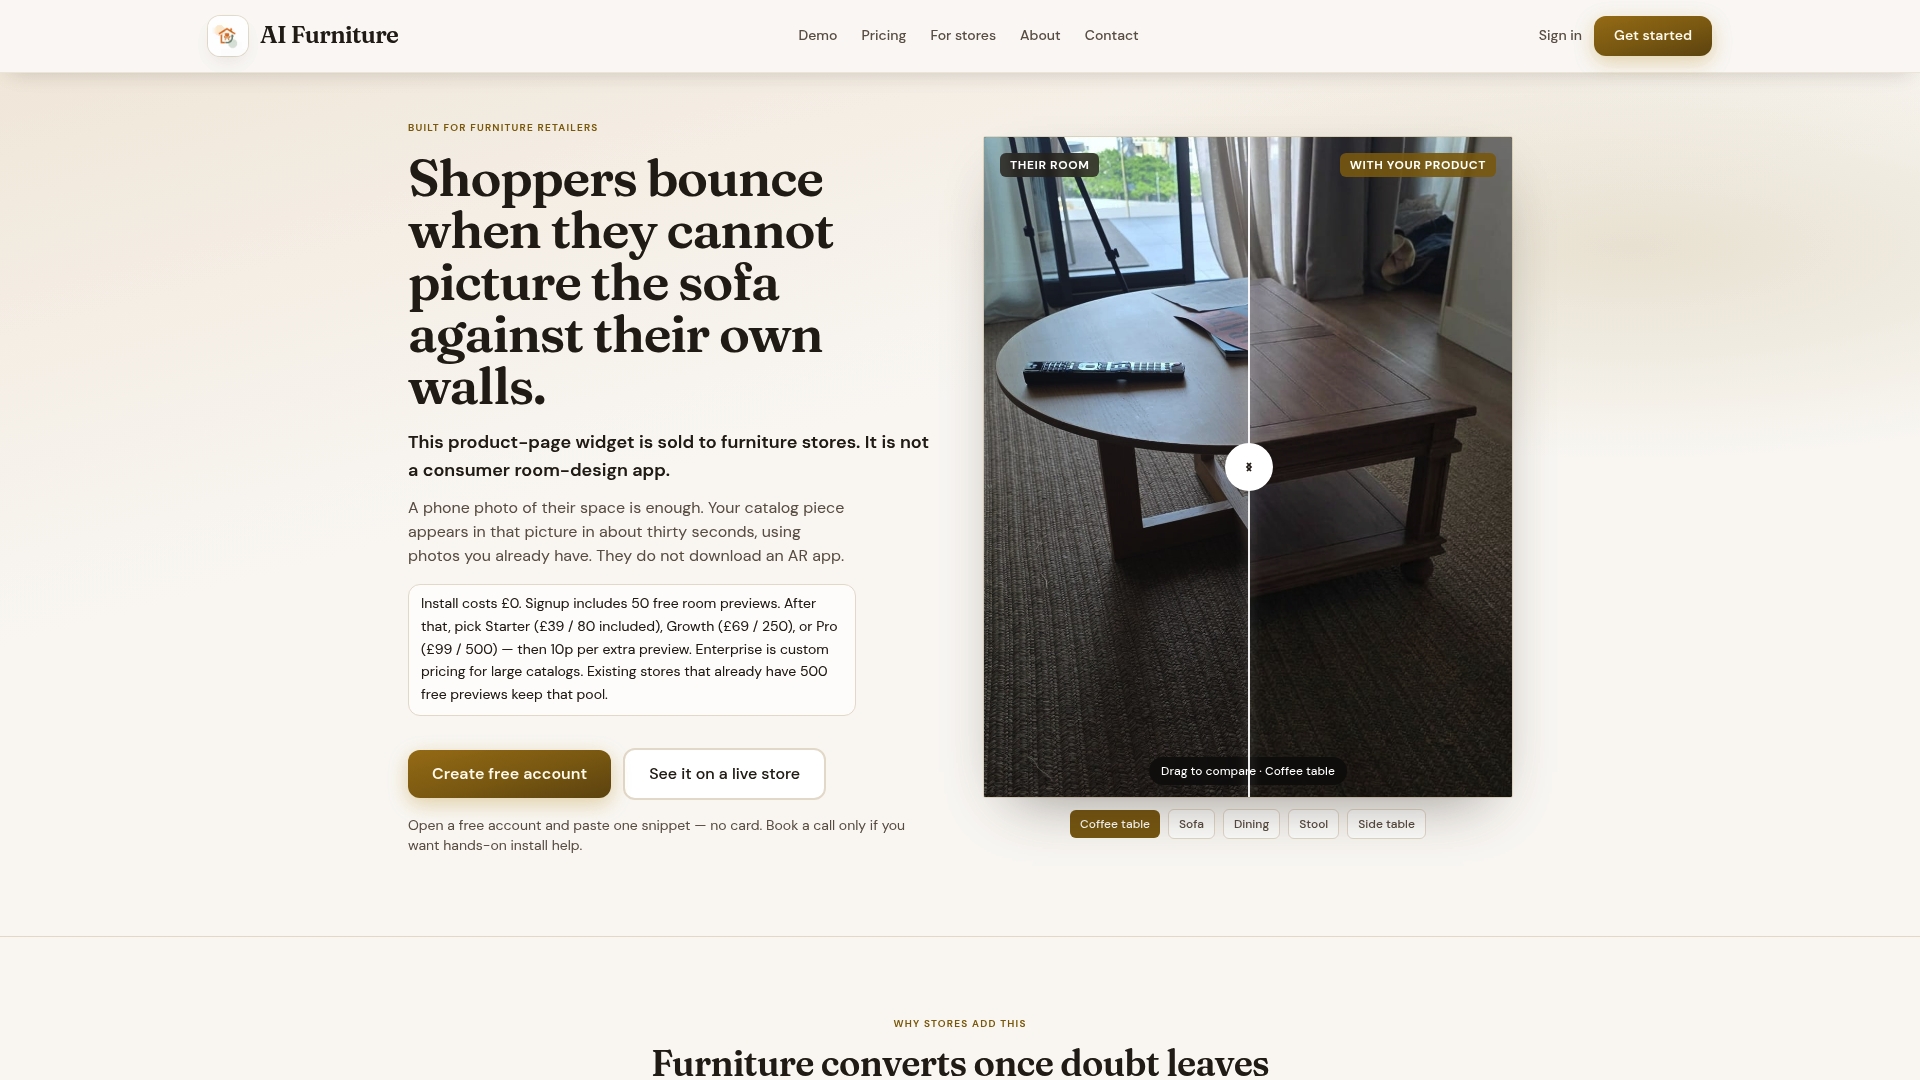
A product-page tool lets shoppers upload a photo of their room and see a retailer's furniture composited into it within around 30 seconds, with no app download required. The first 500 previews are free, which gives you a genuine risk-free way to run the holdout test this article recommends before any money changes hands.
- Run a bake-off on your own product URL to see how the widget performs on your actual catalogue photos.
- Check plan pricing, starting with Starter at $52.56 per month before scaling usage.
- Book a launch call if you want help setting up a proper control group alongside the pilot.
Sources
- Adobe Commerce Intelligence — repeat orders and performance
- Furniture & Home Decor quantitative UX insights 2026 — Baymard
- Select attribution settings - Analytics Help
FAQ
What is the returning customer rate in ecommerce?
Returning customer rate is the share of orders or customers in a period who have purchased before, and it varies widely by category and business. Returning purchasers often generate disproportionate value relative to their share of visits, which is why tracking downstream repeat behaviour matters for widget ROI in high-consideration categories like furniture.
What does ROI mean in the context of ecommerce?
ROI in ecommerce means the incremental profit a tool or campaign generates relative to its full cost, not the raw revenue a dashboard attributes to it. The correct approach converts incremental revenue to gross contribution using margin and subtracts total implementation and operating cost before calling a result positive.
How long does it typically take a widget to pay back its cost?
Payback period depends entirely on your traffic, baseline conversion rate, margin and the widget's actual lift, so there is no universal figure. Running the formula from a worked example against your own numbers, with a proper control group, is the only reliable way to find your payback period.
How is conversion lift measured accurately for a widget?
Accurate lift measurement compares an exposed group against a genuine control or holdout group that never saw the widget, not a before-and-after comparison on the same traffic. Attribution model choice in analytics tools also affects the reported number, so the model should be fixed and documented before you start comparing results.
Do room-preview visualisers reduce returns for furniture?
Room-preview tools address fit anxiety directly, which Baymard's furniture UX research ties to abandonment and return rates. Measuring the change in fit-related returns after launch is the most direct way to see whether a visualiser is working for your catalogue.